Tools
Hydra can output several types of files for visualization that include both field data and time-history data at varying time-intervals. By default, the Exodus-II file format is used for field data, while an ASCII format is the default for time-history data. In addition, global data, e.g., kinetic energy, is output in an ASCII format.
The file formats for field data are compatible with a number of popular visualization tools that include:
The file formats used for time-history data may be used with a number of tools that include:
If you don't find a visualization tool here that you like, the Hydra Toolkit provides a flexible interface for I/O that permits easy extension for additional file formats.
In-Situ Visualization
The traditional work-flow of running the simulation, dumping out solution files and then post-processing these solution files is based on loose coupling (i.e. file-based sharing of information) between Hydra and the post-processing package. As simulation runs become bigger this file I/O bottleneck will increase substantially. By computing desired information in-situ, Hydra moves from a loose-coupling to a tight-coupling where now the information is shared through system memory instead of files. Besides the reduced file IO, this also has the following benefits:
- Analysis and visualization is done on the same computing power as the simulation uses instead of on a lower-powered machine. This results in faster time to insight into the problem at hand.
- Quick and easy run-time checks to verify that the simulation is setup properly.
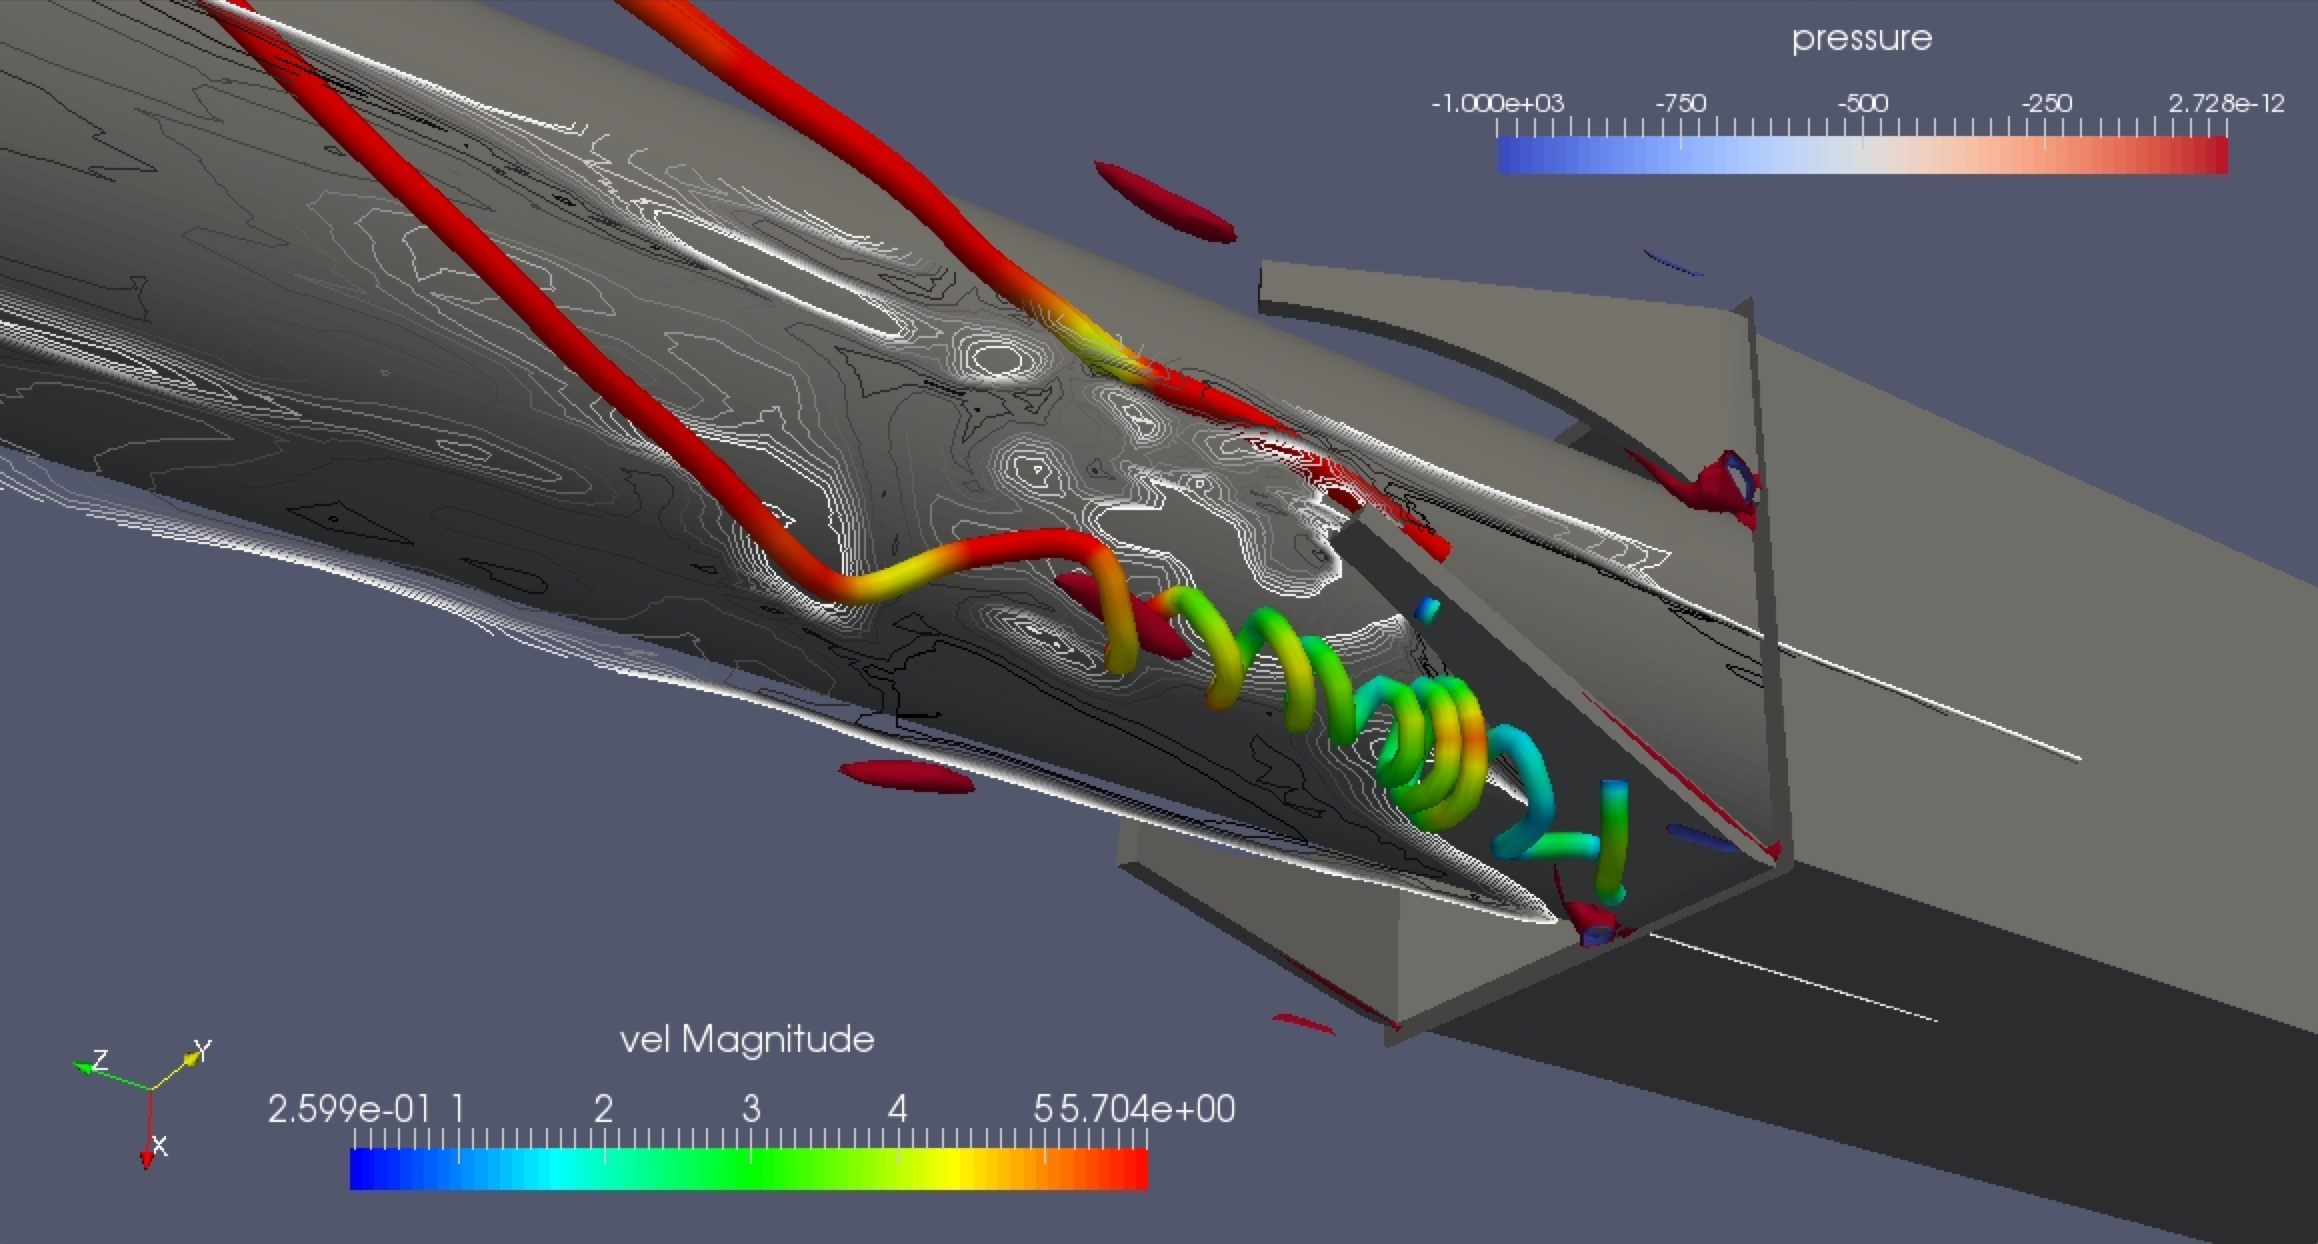
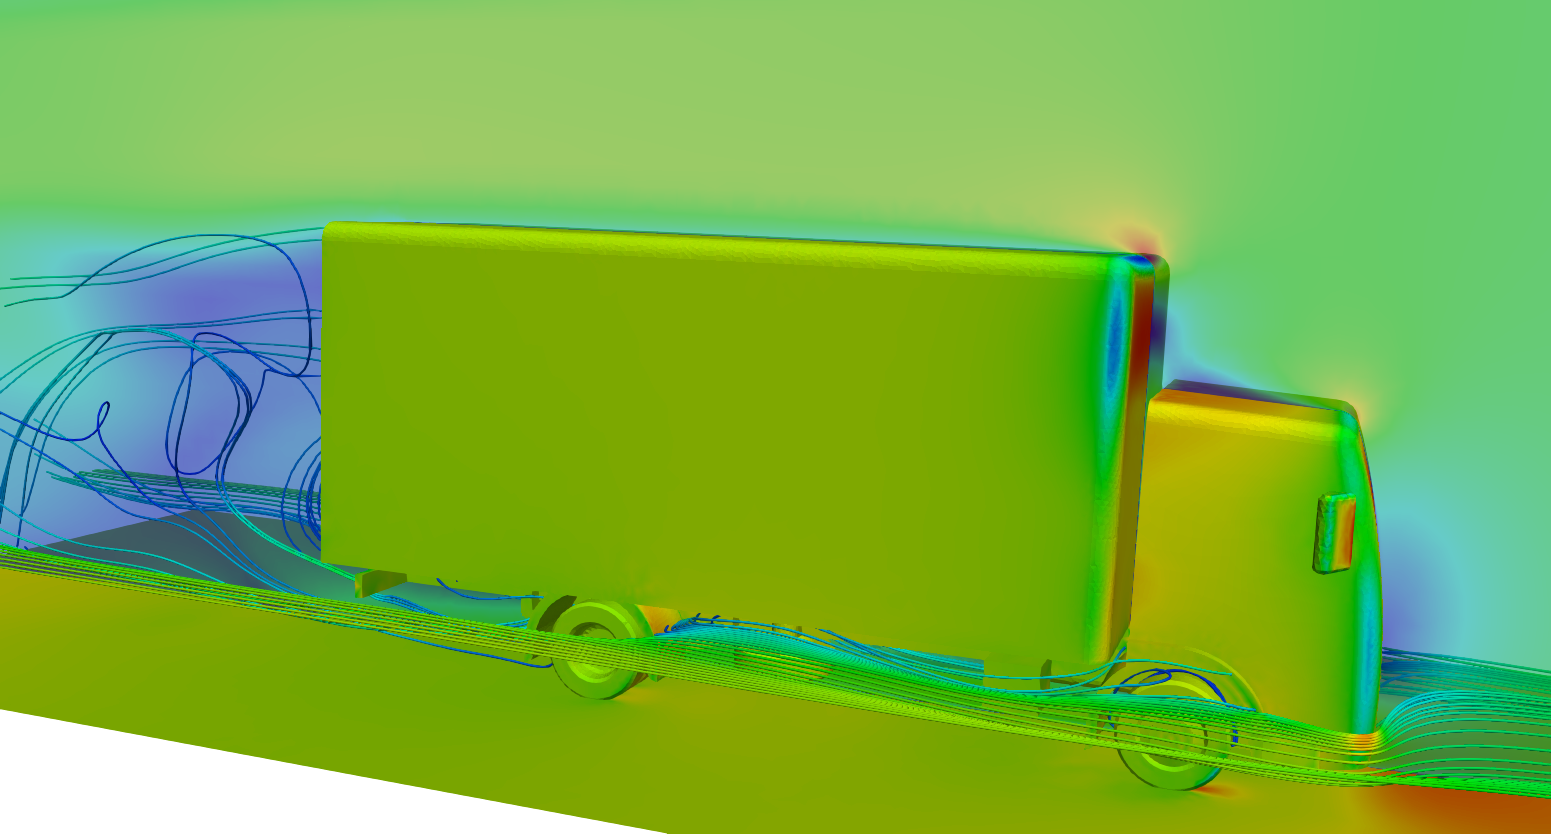
- Analysts have more control over what information is and is not saved. The traditional work-flow requires saving the entire grid and selected fields at specific points in the simulation run. Since results are in frequently saved to disk due to the high costs of saving the entire set of data, there is already culling of data occurring for simulation runs. In-situ analysis and visualization allow culling data by means other than by time step. For example, boundary surfaces, streamlines and/or iso-surfaces can be extracted. Surface data tends to be two orders of magnitude less than the entire data set. Streamlines and images are even more compact.


